The internet has transformed the way we perceive and interact with the world around us. What once required extensive data gathering, expert analysis, and slow dissemination through newspapers or television can now be accessed instantly from any digital device. A prime example of this transformation is the accessibility of real-time weather maps.
These maps, once limited to meteorologists and pilots, are now available to the general public with just a few clicks. Live radar images show precipitation, storms, and temperature changes as they occur, allowing individuals to make informed decisions about their daily activities, travel plans, or even long-term strategies related to agriculture and infrastructure.
But this is only one facet of the broader evolution in environmental monitoring. Alongside weather data, people can now access detailed and interactive tools that provide insight into another crucial aspect of environmental health: air quality. Just as weather maps have become standard tools in daily life, the air quality map is emerging as an equally important feature, helping us understand the condition of the air we breathe and the potential health implications it carries.
What Is an Air Quality Map and How Does It Work?
An air quality map is a digital visualization tool that compiles data from thousands of air quality monitoring stations and sensors deployed across various regions. In Europe alone, hundreds of networks contribute to such maps, drawing data from national meteorological services, environmental agencies, and citizen-led sensor networks. These stations collect information on pollutants such as nitrogen dioxide (NO₂), ozone (O₃), carbon monoxide (CO), and particulate matter—especially PM2.5 and PM10, which are considered among the most harmful.
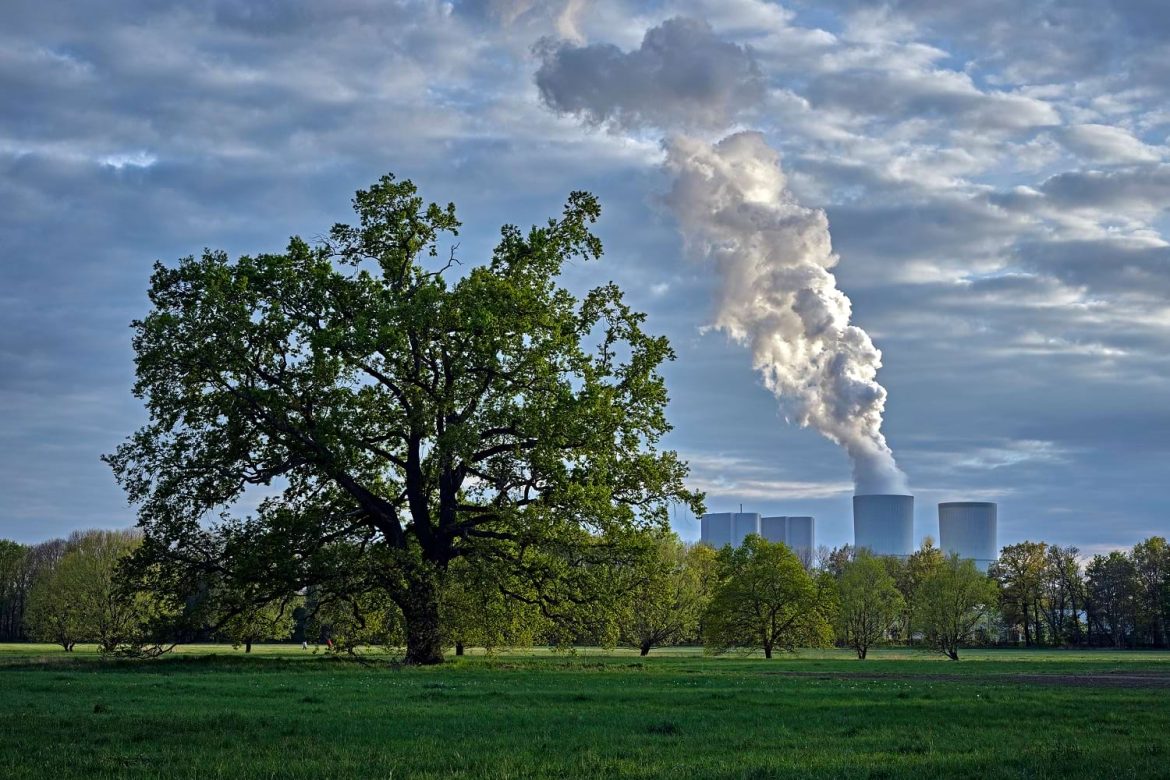
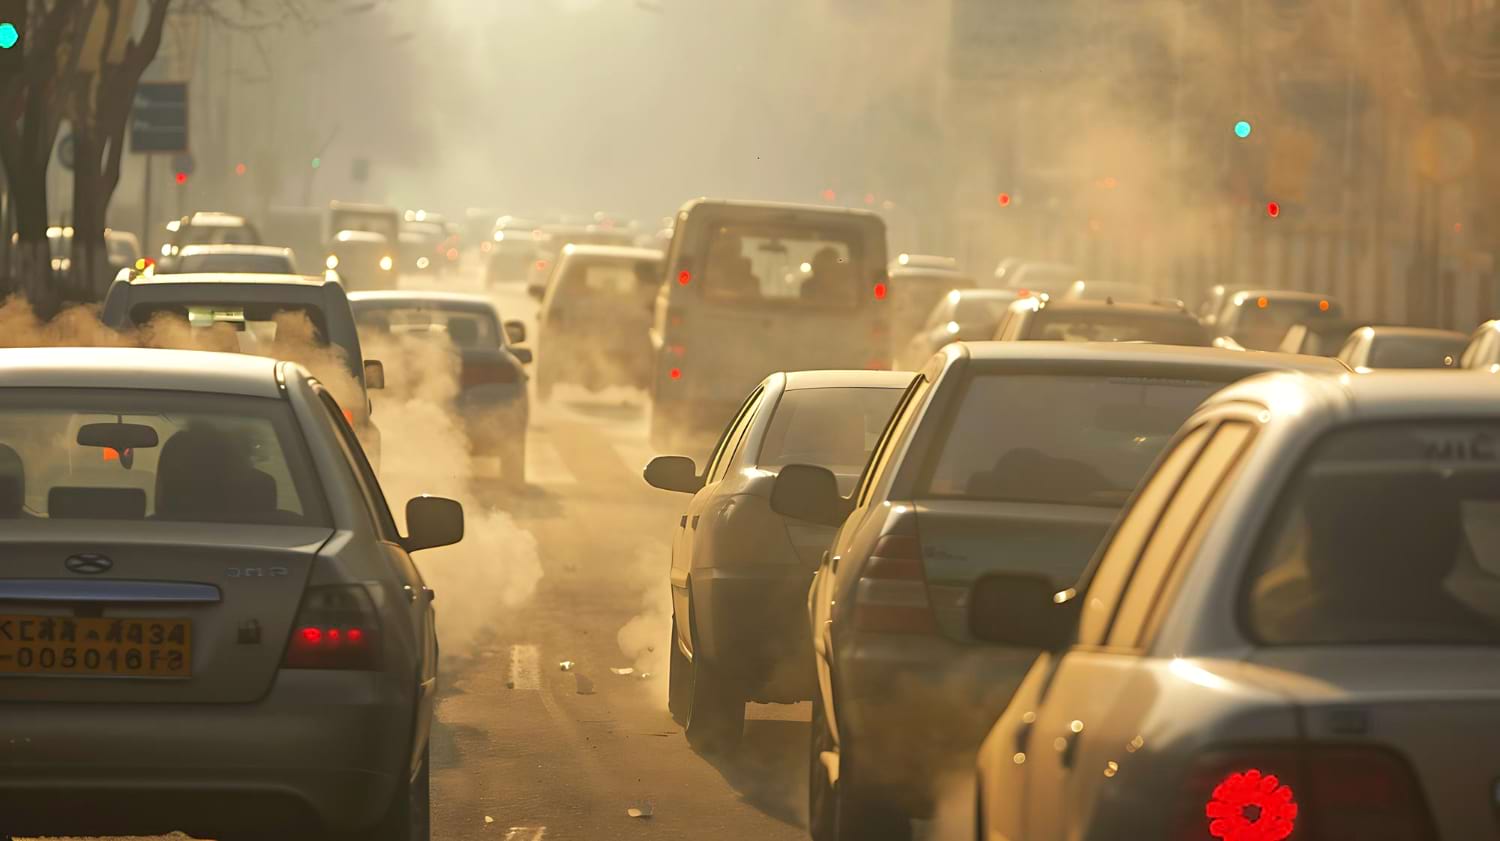
PM2.5 (particles with a diameter of 2.5 micrometers or smaller) and PM10 (particles up to 10 micrometers) are capable of penetrating deep into the lungs and even entering the bloodstream. These particles often originate from car exhaust, industrial activity, agricultural practices, and natural sources such as dust storms and wildfires. Monitoring their levels is essential because their presence correlates with serious health risks, including respiratory diseases, cardiovascular issues, and even neurological disorders.
The Benefits of Air Quality Maps in Public and Personal Life
The widespread availability of air quality maps provides numerous advantages for individuals, institutions, and governments alike. For the average citizen, these maps serve as a valuable planning tool. Parents of children with asthma, for instance, can consult the map before deciding whether outdoor activities are advisable. Elderly individuals or those with chronic lung conditions may choose to stay indoors when pollution spikes. Runners, cyclists, and other outdoor enthusiasts can avoid exposure during peak pollution hours by timing their activities accordingly.
For educators, air quality maps can be incorporated into science curricula to teach students about environmental science, climate change, and human impact on natural systems. Urban planners and policymakers also rely on such data to make informed decisions about zoning, traffic regulations, and public transportation investments. Some cities have implemented low-emission zones or restricted car access in response to consistently high readings on the air quality map.
Technological Infrastructure and Data Integrity
The accuracy and utility of an air quality map depend heavily on its technological infrastructure. Sensor networks must be dense enough to capture local variations in pollution, especially in urban areas with complex topographies and microclimates. High-quality sensors, regularly calibrated and maintained, are essential to avoid false readings or data gaps. Satellite data, such as those from the European Space Agency’s Copernicus program, can complement ground-based measurements to provide a fuller picture, particularly in rural or remote areas.

Machine learning and big data analytics are now playing a significant role in interpreting this massive stream of information. Algorithms can predict pollution trends based on historical patterns and real-time meteorological data, providing a forecast of air quality in much the same way weather forecasts are generated. This predictive aspect is crucial for effective policy intervention and public health preparedness.
To maintain data integrity, various standardization efforts are underway. Organizations like the European Environment Agency (EEA) and the World Health Organization (WHO) have developed guidelines and calibration standards to harmonize readings across borders. The ultimate goal is to ensure that when a user checks an air quality map in Warsaw, Berlin, or Madrid, they can trust that the data is comparable and accurate.