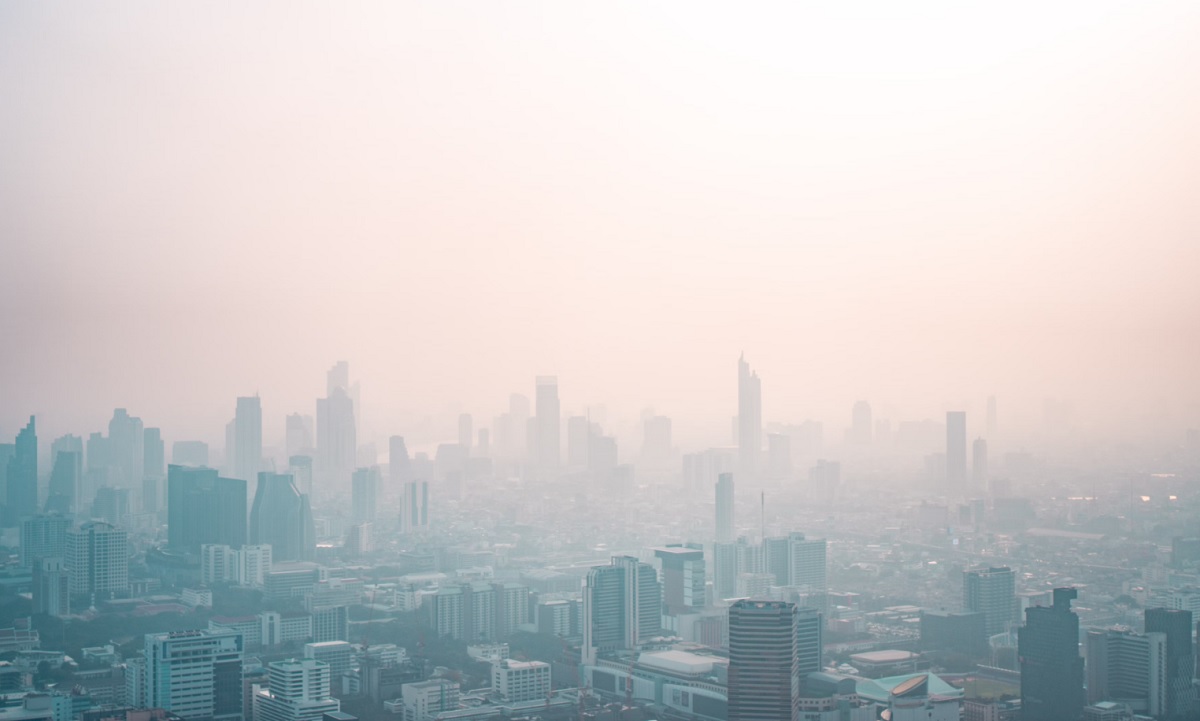
An air quality map is a visual representation that displays the levels of various pollutants and contaminants present in the air across different geographic locations. These maps typically utilize color coding or other visual indicators to depict the concentration of pollutants such as particulate matter (PM2.5, PM10), ozone (O3), nitrogen dioxide (NO2), sulfur dioxide (SO2), carbon monoxide (CO), and other harmful substances.
Air quality maps can be generated by government agencies, environmental organizations, or research institutions using data collected from monitoring stations scattered throughout a region or country. The data collected from these stations are often aggregated and analyzed to create a comprehensive view of air quality patterns over time.

Why it is worth using air quality maps
Air quality has become a paramount concern in today’s world, with increasing urbanization and industrialization contributing to heightened levels of pollution. As we go about our daily lives, we often overlook the quality of the air we breathe, yet it plays a crucial role in our overall health and well-being. Thankfully, advancements in technology have enabled the development of sophisticated air quality monitoring systems, providing us with valuable insights into the composition of the air around us.
Air quality maps – monitoring stations and online platforms
Across the globe, weather stations equipped with specialized instruments are tasked with monitoring air quality. These stations analyze various pollutants such as particulate matter, ozone, nitrogen dioxide, and sulfur dioxide, among others. The data collected from these stations are then disseminated through various online platforms, accessible to the public. These platforms often include air quality maps, allowing individuals to visualize pollution levels in their vicinity and make informed decisions about outdoor activities.
Moreover, the significance of this data extends beyond individual awareness. Local governments and municipalities utilize air quality information to formulate policies and implement measures aimed at curbing pollution levels. By identifying areas with poor air quality, authorities can implement targeted strategies such as promoting public transportation, enforcing emission regulations, or investing in green spaces to mitigate the impact of pollution on public health and the environment.

Air quality maps – air quality testing helps reduce the number of illnesses
Monitoring of air quality is not merely a scientific endeavor but a critical component of public health and environmental management. By leveraging technological advancements in monitoring systems and making data accessible to the public, we empower individuals and authorities to take proactive steps in safeguarding air quality. However, addressing the complex issue of air pollution requires concerted efforts at local, national, and global levels. The use of a large number of sensors will allow you to create very accurate air quality maps. therefore, you should collect as much data as possible. They are useful not only to local governments, which can use them to carry out various ecological activities, but also to companies and industries, which can also have an impact on the natural environment and introduce solutions that reduce pollution.


